As part of our partnership with Apple Music, Genius has added an Apple Music player to millions of songs pages so you can listen right on our website. In addition to making it easier to rap all six minutes of Rap God, the player also serves as an on-boarding funnel for users to sign up for a free trial of Apple Music. We want the process of starting a free trial to feel as obvious and painless as possible, and we track our progress against that goal by the total number of users who have started a trial.
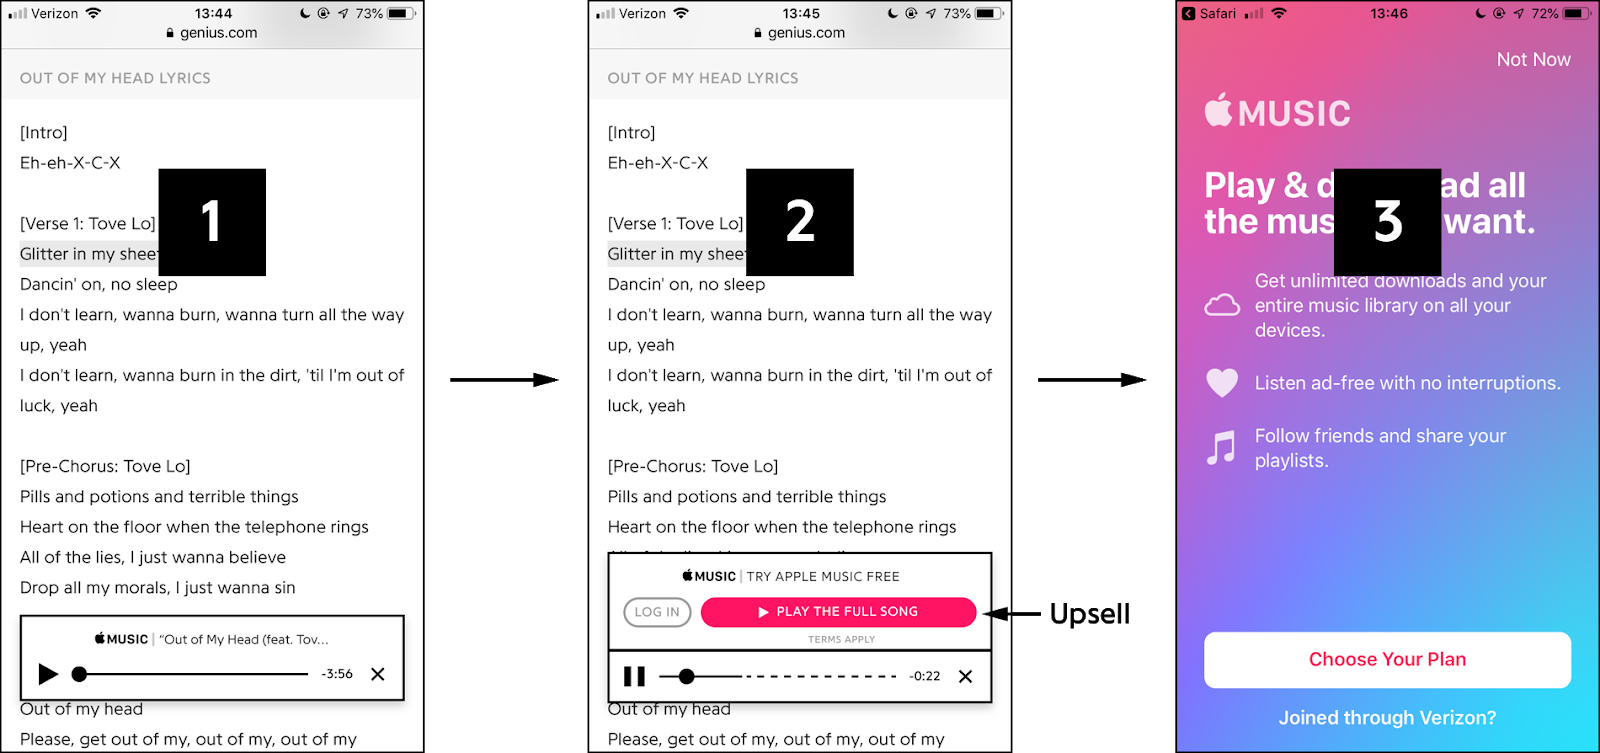
Apple Music subscribers can connect their account to listen to full songs, but by default the player plays a 30-second preview and prompts the user with an “upsell” to sign up for a free trial of Apple Music. This is a standard funnel, detailed in the diagram below, that requires the user to first click on the upsell link and then go through Apple’s on-boarding process. One idea to hammer home all the free value we were offering was to say it out loud, like a podcast ad, at the end of the 30-second preview. After all, you can close your eyes, but you can’t close your ears. Three months of free music is a great deal, but we didn’t want to subject our users to more advertising if it didn’t make a meaningful difference in our trial numbers, so we decided to run an AB test to measure the ad’s efficacy.
Initial AB Test
NOTE: All the numbers in the description below (other than p-values) are for illustrative purposes only. The actual numbers are proprietary.
Without the audio ad, about 8% of users were clicking the upsell link and about 0.2% of users were signing up for a trial. We hoped the test would show us that the audio ad increased the number of trial signups substantially, but, when it came time to execute the test, we ran into some procedural issues. We’re able to track every aspect of the user’s interaction with the Apple Music player on our own site, but once they’ve clicked through to Apple’s signup page, the tracking is no longer in our hands. The tracking for the signups is handled by an external analytics provider. Unfortunately, this provider didn’t give us a way to tag the users we sent to the signup page with an AB test cohort—this meant we could only measure the number of upsell clicks for each cohort, and not the number of trial signups. Eager to get some data on the audio ad, we figured running a test that measured the differences in upsell clicks would at least provide us with some useful information since, all else being equal, an increase in the number of upsell clicks should translate to an increase in the number of trial signups.
The results of the test showed a very slight increase in the number of upsell clicks in the audio ad cohort, but not enough to be statistically significant given the sample size (p = 0.13). The experiment suggested that it was probably better to remove the unnecessary ad. However, when our next analytics report arrived, we noticed that the number of trial signups and the overall trial signup conversion rate had gone up. Was it possible that the ad increased the number of trial signups without affecting the number of upsell clicks? Maybe, but any number of confounding factors could have explained the increased number of trial signups: YouTube going down for an evening, Ariana Grande releasing a smash hit, or analytics hiccups (all of which actually happened during this project). Given that we had data from a controlled experiment suggesting that the ad had minimal effect on a key metric (upsell clicks), the evidence from the report was not enough to be convincing.
AB Test: Round 2
A few weeks later, Apple provided us with a workaround that allowed us to track the number of trial signups—the metric we actually cared about—for each cohort in the AB test. With this new information, we re-implemented the AB test and waited for the results to roll in.
In a surprising turn of events, we observed a more than 60% increase in trial signups from the audio ad cohort!! And this result was statistically significant (p < 0.0001). The hint from the analytics report happened to be correct while our initial “scientific” experiment had misled us. Shouldn’t have measuring upsell clicks at least pointed us in the right direction? Were we just unlucky or was there an explanation for why our experiment turned out to be so uninformative?
Let’s dissect our reasoning for running the experiment. We know that anyone who signs up for a trial has to click the upsell—an obvious fact of any funnel. This suggests a strong connection between those who click the upsell and those who sign up for a trial, but is it actually true that clicking the upsell is a useful test for whether or not the person will sign up for a trial?
An Analogous Situation
Let’s try an exercise with a different type of test to better understand the situation:
A common tool that police officers use to test drunkenness is the breathalyzer. A sober person will be mistakenly identified as drunk by the breathalyzer 5% of the time, but a drunk person will always be identified as drunk. One in a thousand drivers are driving drunk. Suppose a policeman stops a driver at random and tests him or her, and the breathalyzer reads that the driver is drunk. What is the probability that the driver is actually drunk?
This hypothetical scenario was presented to 173 judges in a study by Mark Schweizer in 2003. They then chose an answer out of these four probability ranges: 0–25, 26–50, 51–75, and 76–100%. Most of the judges (68%) chose 76–100% but the actual probability is less than 2%. If only 1 out of 1000 drivers is actually drunk, but 5% of the 999 that aren’t drunk will get a drunk result, then there are a total of about 51 drunk results—only one of which is correct.
| Breathalyzer Drunk | Breathalyzer Sober | Total | |
|---|---|---|---|
| Actually Drunk | 1 | 0 | 1 |
| Actually Sober | 50 | 949 | 999 |
| Total | 51 | 949 | 1000 |
Base Rate Neglect
Our initial experiment that used upsell clicks as a test for trial signups is remarkably similar to the breathalyzer scenario. In fact, we can phrase it almost identically:
A tool we use to test whether or not a user signs up for a trial is whether or not he or she clicks the upsell. A user who is not willing to sign up for a trial will be mistakenly identified as a user who is willing to sign up for a trial by an upsell click 10% of the time, but a user who is willing to sign up for a trial will always click the upsell. Two in a thousand users are willing to sign up for a trial of Apple Music. Suppose we observe a user session at random and the user clicks on the upsell link. What is the probability that the user actually signs up for Apple Music?
The probability that the user signs up for Apple Music is, like the breathalyzer case, less than 2%! (Again, the actual statistics have been redacted, but the numbers are illustrative of the phenomenon we observed.) Given this analysis, it would not make sense to use upsell clicks as a measurement for whether or not a product change like the audio ad altered the rate of users signing up for a trial. Analogously, if policymakers enacted a law to reduce drunk driving, it would not make sense to use breathalyzers to measure the efficacy of that law. In both of these cases, it is clear that the approximate variables are not good enough, and it would be a poor use of time and resources to measure them. Instead, we should directly measure the relevant metric or, if that is not feasible, trust our intuition.
The original experiment that measured upsell clicks had a dangerous pretense of providing “scientific” evidence which almost led us to drop the audio ad and, consequently, lose potential trial signups. We were lucky to have gotten a second chance to make it right. Our experiences serve as a reminder that if you can’t conduct an experiment properly, it’s often better not to do it at all.
- If you are familiar with Bayes’ theorem (posterior probability ∝ prior probability * likelihood), the error in reasoning is focusing on the likelihood while ignoring the prior probability when trying to come up with the posterior probability.
- The base rate fallacy observed here does not apply to all tests or populations in general. For example, if we were interested in newsletter signups and 50% of people who click the upsell link for the newsletter actually sign up, then an experiment measuring upsell clicks would be much more likely to be informative.