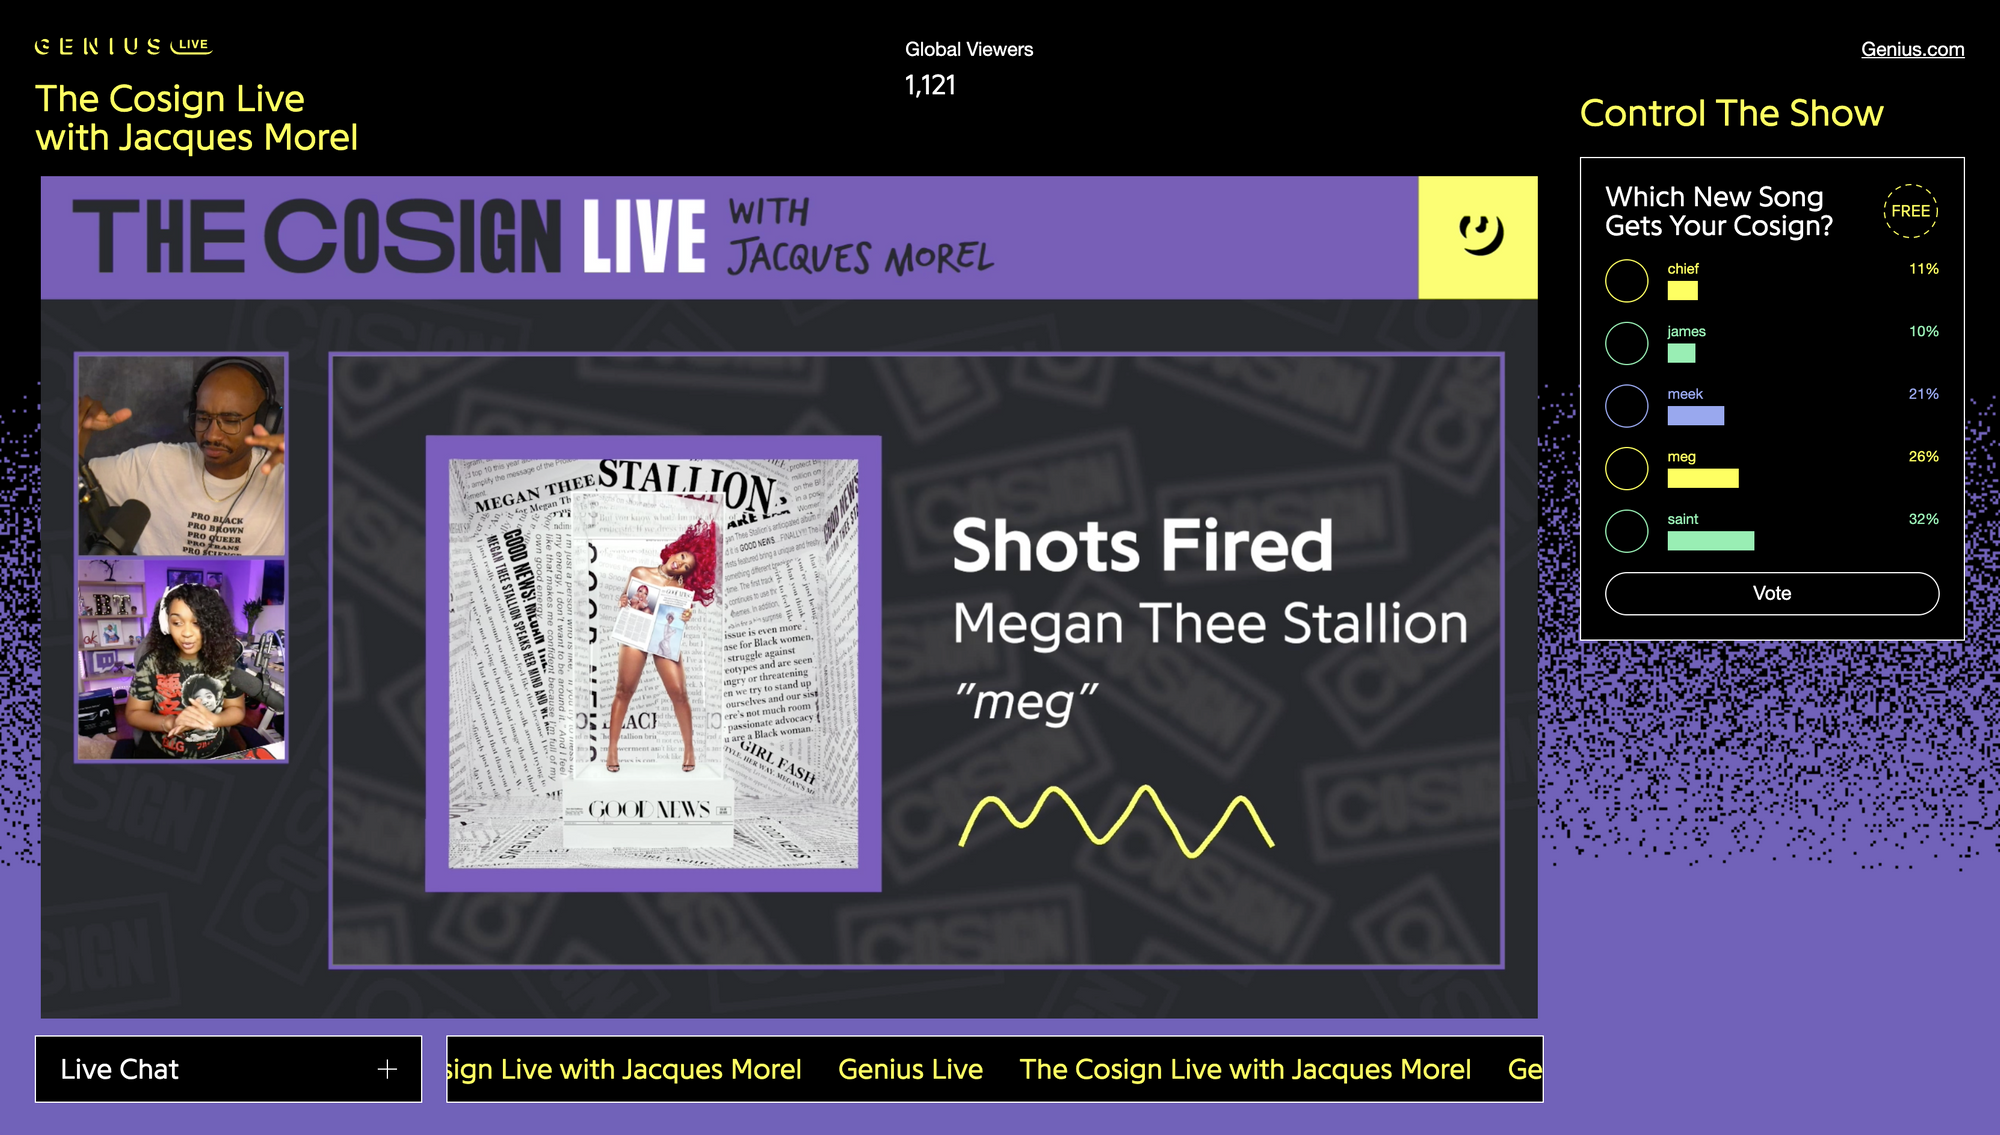
With in-person concerts on pause this past year, we at Genius have been working on Genius Live, a new live streaming platform where fans control the show.
Polls are one of the core features, letting fans decide parts of the artist's setlist in real time. The format isn't set in stone yet, and we've been experimenting with the number of song choices and other factors.
Tie breaking
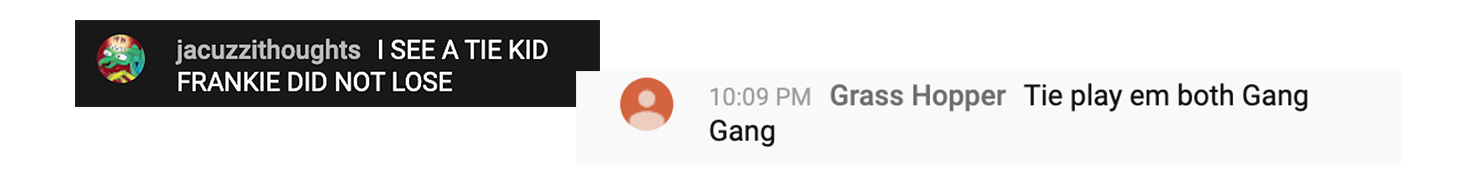
During our first show with Wiz Khalifa, one of these setlist polls ended in a tie– 218 votes each for "Medicated" and "The Kid Frankie".
Our production team ended up resolving things behind the scenes, but the poll results still showed there had been a tie, confusing (and somewhat infuriating 😬) the audience.
In the weeks following the event, we spent a lot of time figuring out how to reduce the platform's overhead for our producers, and that had to apply to how we solved the tie problem as well.
As nice as it would be to have a human consider how to break a tie, I realized that it would not only burden the production team with extra responsibilities, but complicate all of the workflows that are supposed to be run when a poll ends. Not only does the artist have to perform one of these songs, but we have to update our data and video feeds accordingly. It's also just not very transparent!
We decided it'd be much simpler to have the system decide how to resolve a tie deterministically, using the timestamps of the most recent vote on each option.
See the Pen Poll tie breaker by @cubeghost on CodePen.
To choose a winner, we look at which option has the oldest "last vote". Phrased in a less confusing way, that's the one that reached the winning number of votes first.
Math is easy
After our second show, one of our producers sent this message:
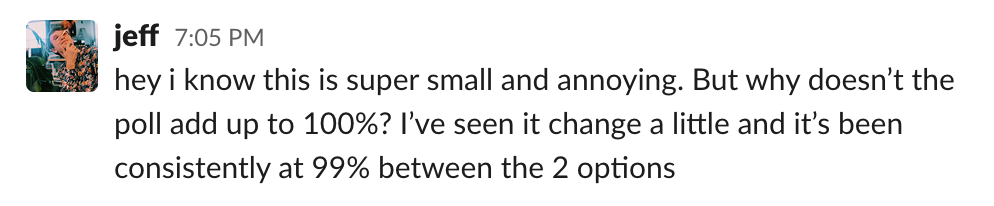
Glancing quickly at the code, I noticed we'd been naively using Math.floor to round the percentages 😳. I thought hey, easy fix, right? Just change floor to round. This helps, and it feels more correct than using floor, but if that alone was the fix, I wouldn't be writing a blog post.
So what's the problem?
See the Pen Poll rounding: naive Math.round method by @cubeghost on CodePen.
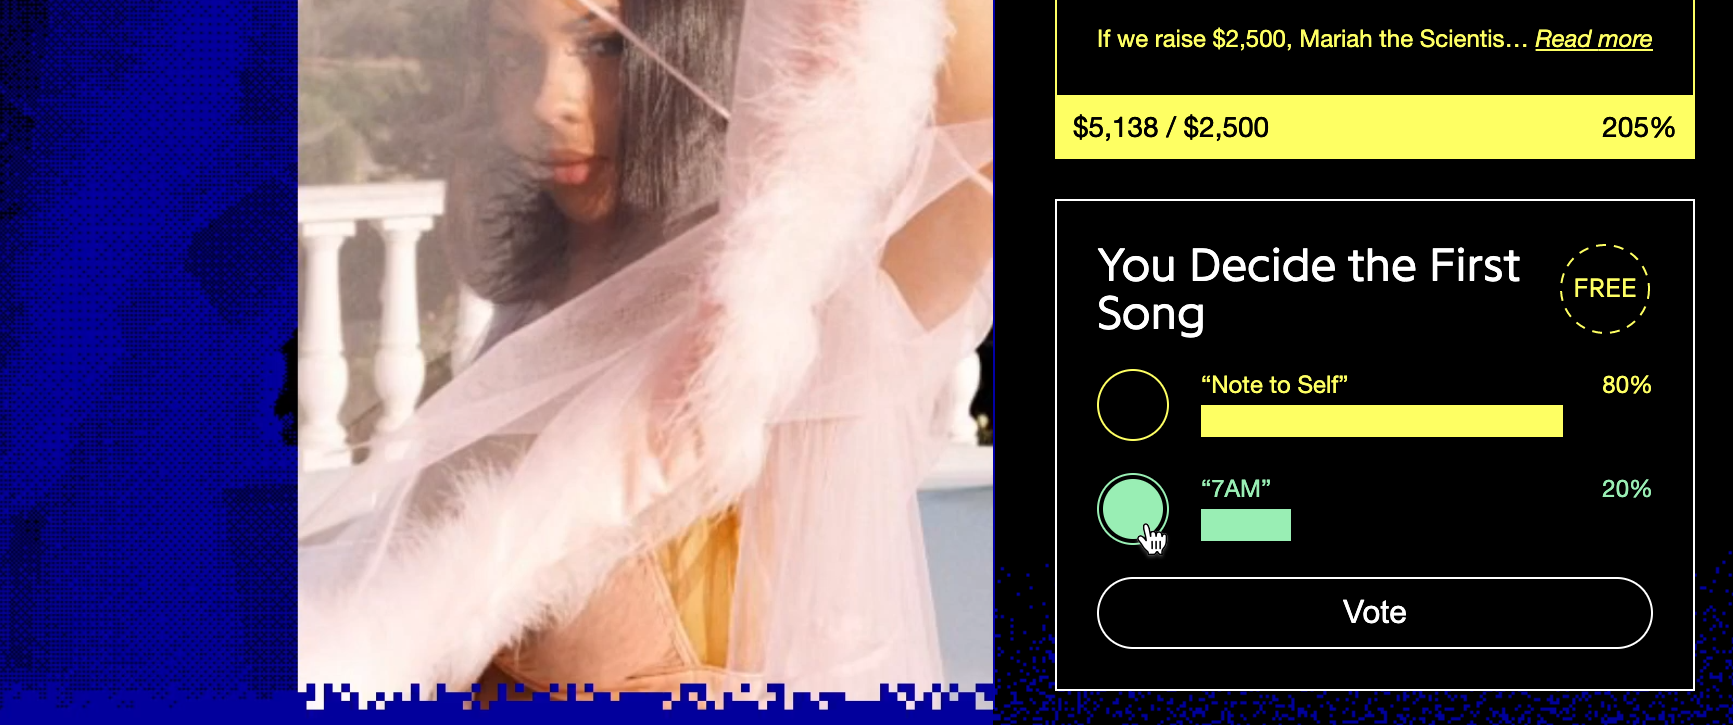
Looking at the "basic" example above, everything looks good, right? 33.33% rounds down to 33%, and 66.67% rounds up to 67%, and those sum to 100%. This works because one value is rounded up and the other is rounded down.
But take a look at any of the other examples and that falls apart. If you select the "pointFive" option in the dropdown above, both 50.5 and 49.5 round up, totaling to 101% 🚨. The results of a 3-way tie all round down as well, totaling to 99% 🚨.
The largest remainder method
It's not like this is a new problem. As one does, especially when something involves math, I headed over to StackOverflow to see how other people have resolved this. There are quite a few approaches detailed in the answers, all dealing with how to distribute the remainder and minimize statistical errors.
One of the most popular methods is the Largest Remainder Method. There are a couple of variations, but we went with a relatively simple one.
- Round each percentage down, and keep track of the decimal remainder
- Take the sum of all the rounded percentages and get the margin of error from 100
- Distribute that margin to the percentages that had the highest decimal remainders
Unfortunately, there are still edge cases where this doesn't work. What if all the decimal remainders are the same, like a 2-option poll with remainders of 0.5, or a 3-way tie? Some proposed solutions include calculating and minimizing the relative error rate (rounded-up percentage / total percentage - 1) instead, but even the mathiest solutions can't solve a 3-way tie on their own. 🤔
In writing test implementations, I realized we have a secondary factor that none of these algorithms do– the tie breaker logic! Combine this with a simplified approach to the relative error rate method, and we have a fairly straightforward way to distribute the margin of error.
See the Pen Poll rounding: largest remainder method by @cubeghost on CodePen.
First we sort by the decimal remainder, then by the total vote count (this has basically the same effect as using the relative error rate, but is way simpler to implement), and finally by the last vote time.
Now we have an algorithm that can resolve ties in a way that's fair, consistent, and always adds up to 100%! It's also easy to unit test using many of the edge cases shown in the CodePen examples. As we experiment with the format, we can be confident that polls won't require any manual intervention or post-show data excavation.